English

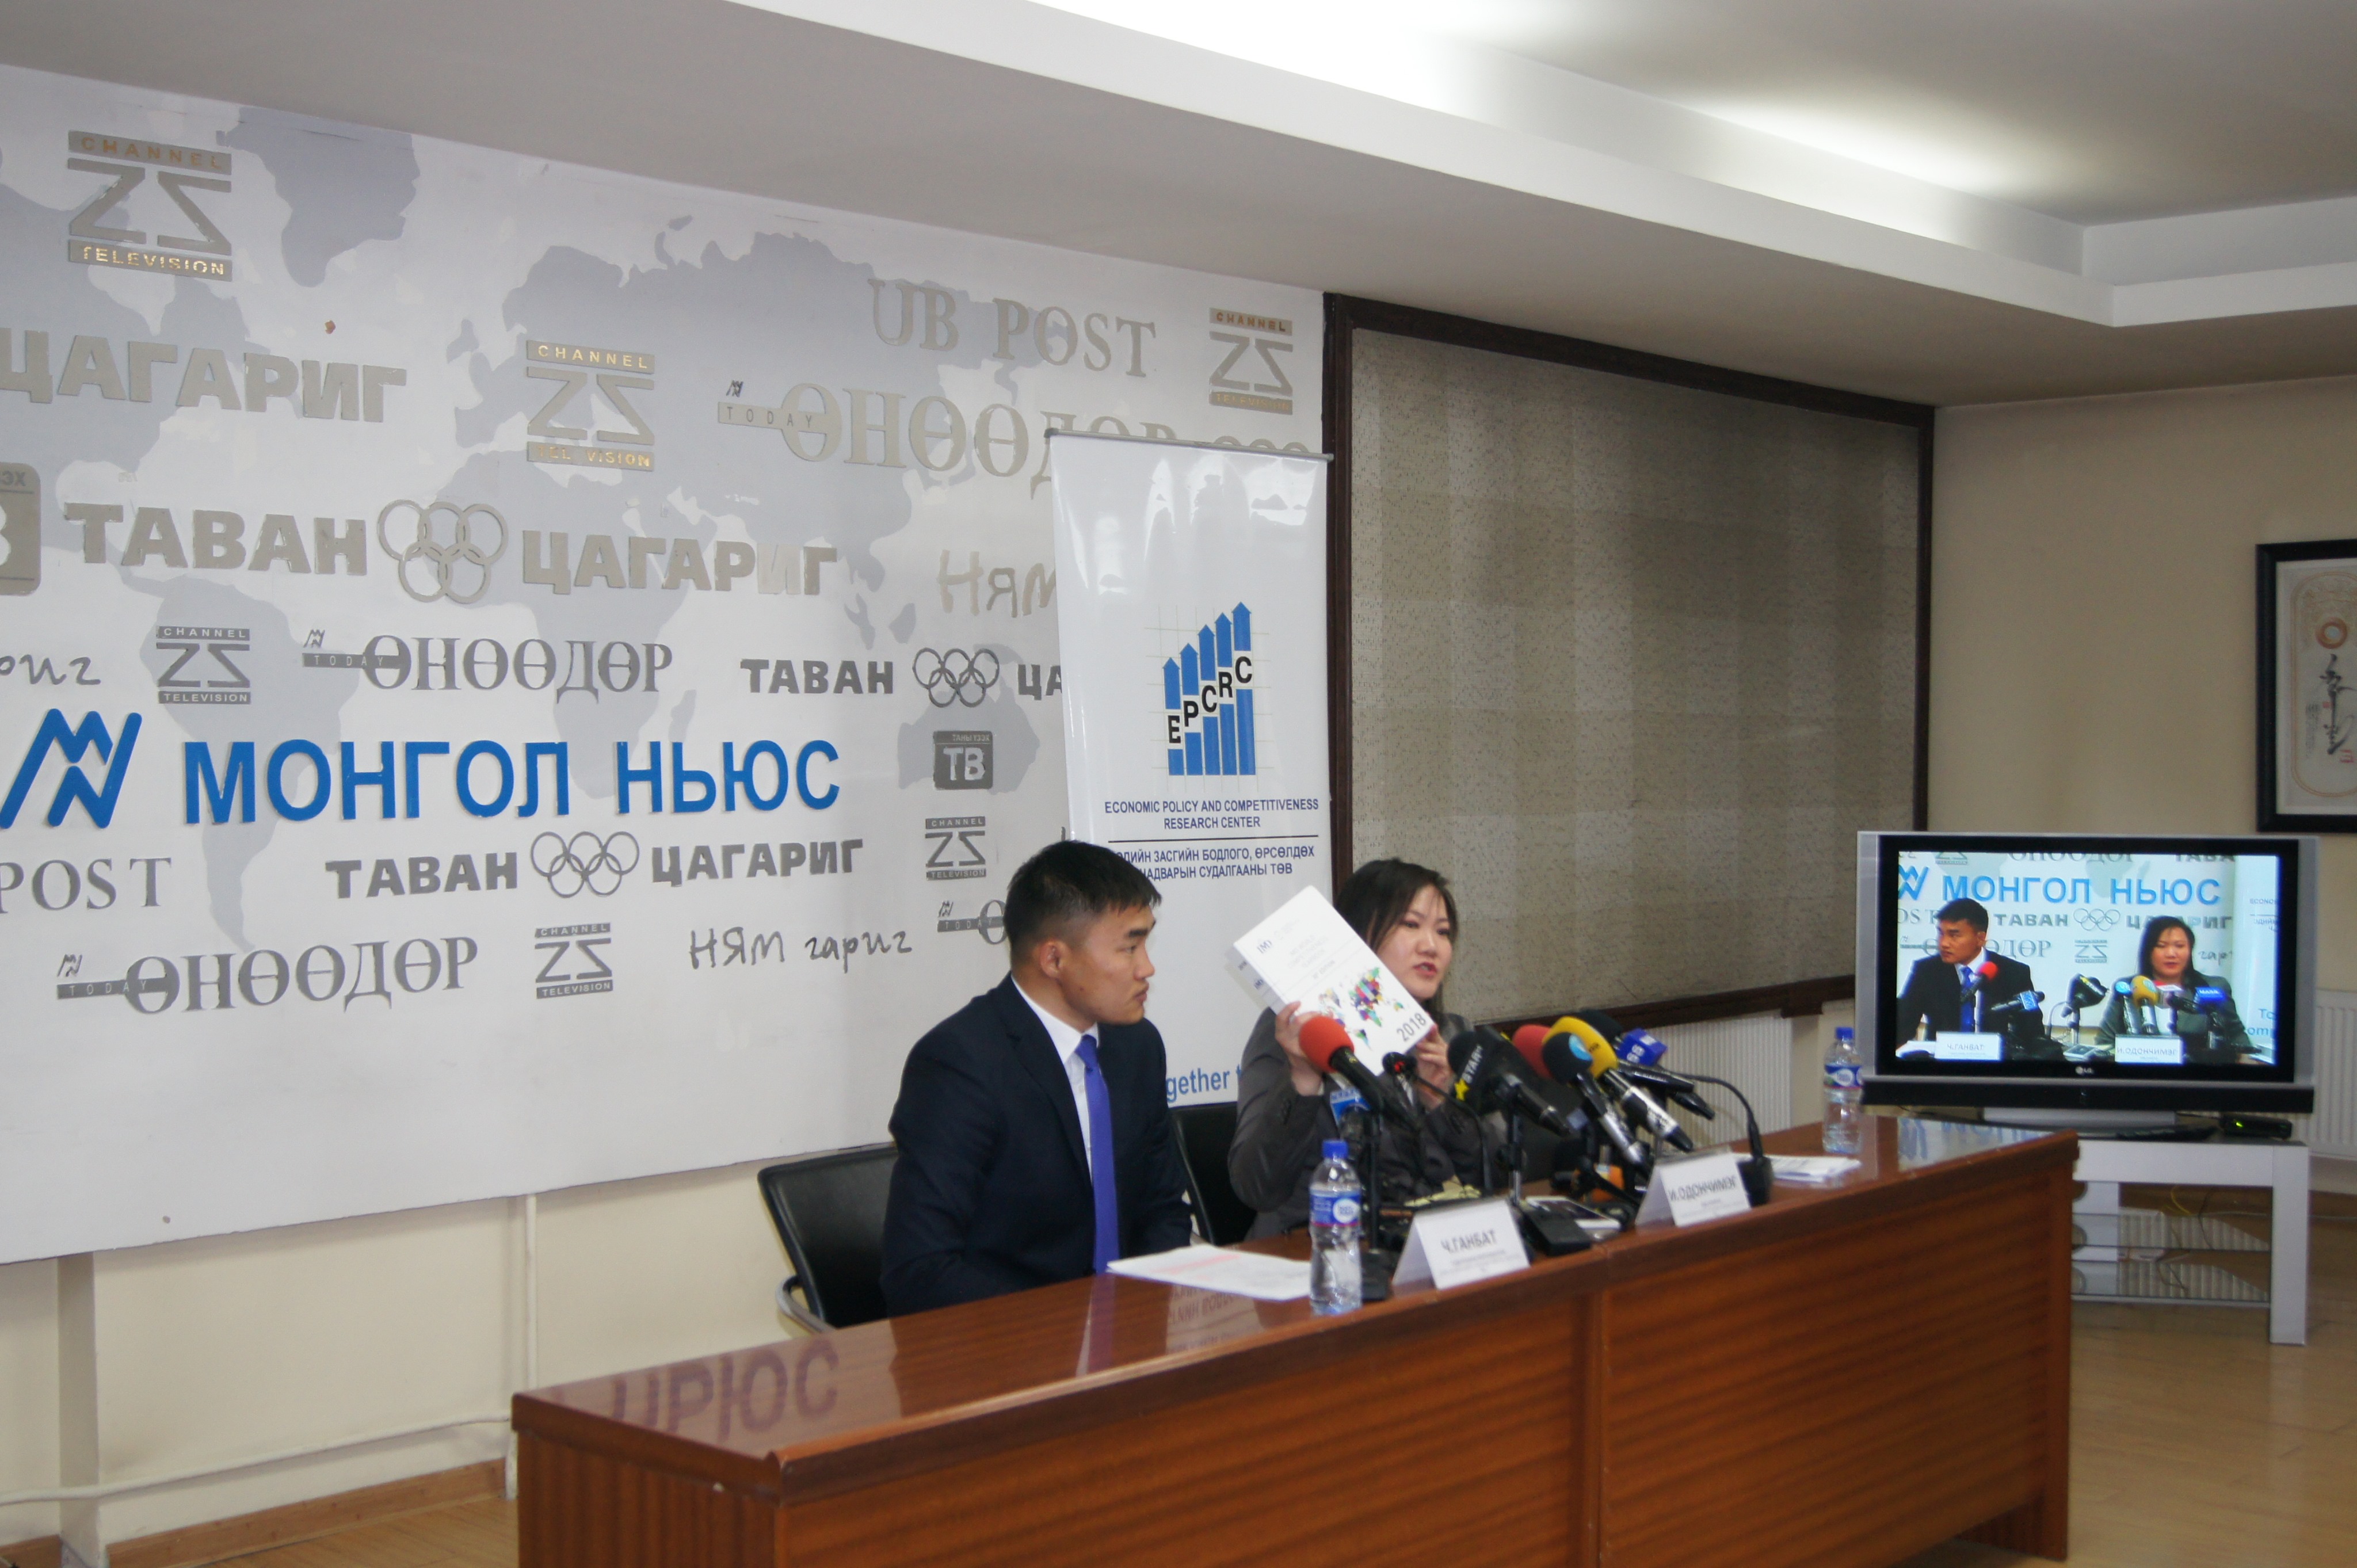
The IMD World Competitiveness Center is presenting this year’s “IMD world competitiveness yearbook 2019”. Since 2010, the Economic Policy and Competitiveness Research Center (EPCRC) has been working with the IMD World Competitiveness Center and providing with necessary data to measure the competitiveness of Mongolia. The data include hard-statistical data and executive opinion survey.
IMD WORLD COMPETITIVENESS YEARBOOK 2019
The study ranks 63 different economies of the world. The ranking is calculated on the basis of 235 ranked criteria out of 332. Among the 235 criteria, 143 of them are from hard and 92 of them are from the survey data.
The IMD World Competitiveness Center presents the overall competitiveness rankings and the 5-year trends for each of the four Competitiveness Factors: Economic Performance, Government Efficiency, Business Efficiency, and Infrastructure. Thus, the reader is able to analyze the evolution of an economy’s performance over the past few years relative to the others on a global basis.
This year Singapore, Hong-Kong, and the USA ranked high in competitiveness whereas Argentina, Mongolia, and Venezuela captured the last positions. Russia and China, our two neighbouring countries are ranked at 45th and 14th.
COMPETITIVENESS OF MONGOLIA
Even though Mongolia kept the last year’s ranking of 62nd out of 63 countries, its overall competitiveness score decreased.
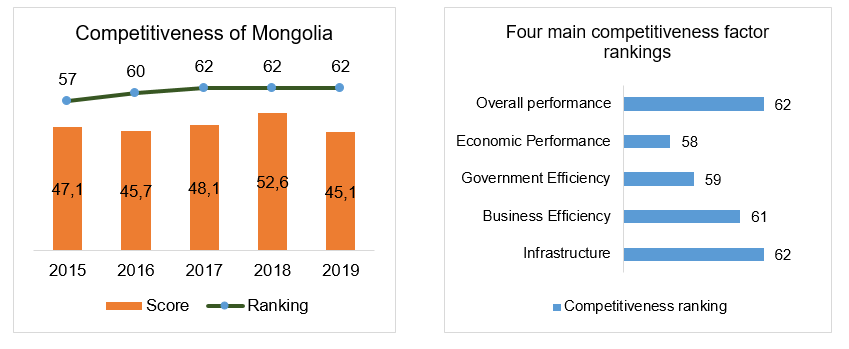
Out of four main competitiveness factors, Economic Performance ranked the highest with the 58th place (ranked at the 48th last year).
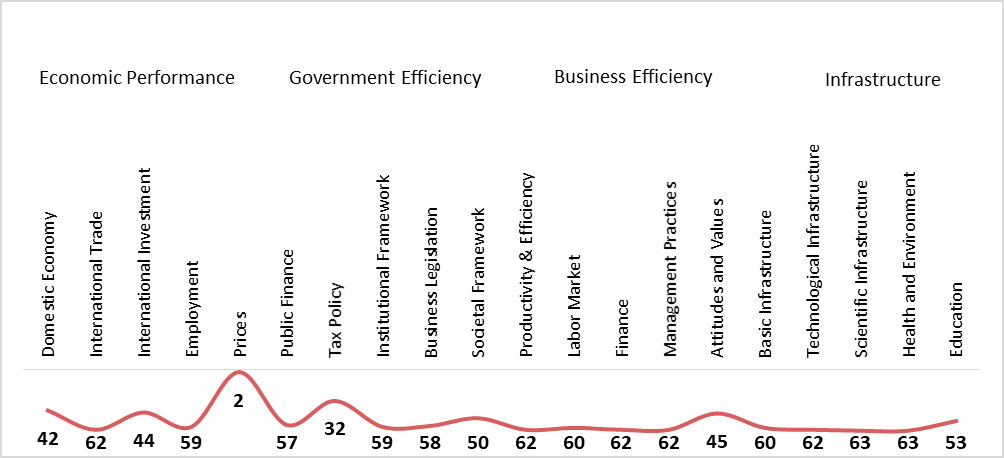
Competitiveness landscape
As one can see from the graph above that a sub-factor called prices which include indices such as consumer price inflation, cost-of-living index, apartment and office rent ranked high compared to other countries.
On the other hand, sub-factors such as international trade, productivity & efficiency, management practices, technological infrastructure, scientific infrastructure, and health and environment ranked low.
Factors which affected the decrease in the overall competitiveness score:
Over the last one year, the criteria such as the total expenditure on R&D, government budget deficit, exports of commercial services, capital markets, and tourism receipts were highlighted the biggest improvements in the overall performance of the economy. On the other hand, the criteria such as consumer price inflation, current account balance, transparency, and pension funding were contributed to the biggest declines.
Apart from the aforementioned factors, some sub-factors such as employment, business legislation, health and environment, and education affected the declines in the overall economic performance of Mongolia.
CHALLENGES IN 2019
- Impending foreign debt repayments may pose some risks for the growing economy.
- Upcoming Parliamentary election may result in political instability and policy discontinuity.
- Foreign Direct Investment may decrease due to the election.
- Inflation may increase due to high domestic demand resulting from increased government expenditure.
- Social and economic costs of severe air and soil pollution levels in urban areas are posing considerable challenges for the country.
STRENGTHS AND WEAKNESSES OF MONGOLIA
STRENGTHS WEAKNESSES
|
Economic Performance |
Rank |
Economic Performance |
Rank |
|||
|
1.1.18 |
Gross fixed capital formation – real growth |
1 |
1.2.17 |
Export concentration by partner |
63 |
|
|
1.5.04 |
Office rent |
1 |
1.2.02 |
Current account balance |
63 |
|
|
1.1.14 |
Real GDP growth |
2 |
1.2.12 |
Exports of commercial services ($bn) |
63 |
|
|
1.3.06 |
Direct investment flows inward (% of GDP)3 |
1.2.18 |
Export concentration by product |
63 |
||
|
1.3.08 |
Direct investment stocks inward (% of GDP) |
6 |
1.3.03 |
Direct investment stocks abroad ($bn) |
63 |
|
|
1.1.09 |
Gross fixed capital formation (%) |
6 |
1.2.08 |
Exports of good ($bn) |
61 |
|
|
1.1.15 |
Real GDP growth per capita |
7 |
1.1.19 |
Resilience of the economy |
60 |
|
|
1.5.06 |
Gasoline prices |
9 |
1.3.07 |
Direct investment stocks inward ($bn) |
59 |
|
|
1.2.09 |
Exports of goods (%) |
14 |
1.3.04 |
Direct investment stocks abroad (% of GDP) |
59 |
|
|
1.2.23 |
Trade to GDP ratio |
19 |
1.5.01 |
Consumer price inflation |
59 |
|
|
Government Efficiency |
Rank |
Government Efficiency |
Rank |
|||
|
2.2.09 |
Consumption tax rate |
12 |
2.2.07 |
Effective personal income tax rate |
63 |
|
|
2.5.14 |
Disposable Income |
14 |
2.4.09 |
State ownership of enterprises |
62 |
|
|
2.2.11 |
Employer’s social security contribution rate |
16 |
2.4.10 |
Competition legislation |
62 |
|
|
2.4.07 |
Government subsidies |
16 |
2.3.04 |
Country credit ranking |
61 |
|
|
2.4.19 |
Redundancy costs |
20 |
2.3.05 |
Central bank policy |
61 |
|
|
2.5.06 |
Gini coefficient |
24 |
2.5.04 |
Risk of political instability |
61 |
|
|
2.2.01 |
Collected total tax revenues |
24 |
2.4.02 |
Protectionism |
61 |
|
|
2.2.10 |
Employee’s social security contribution rate |
33 |
2.3.11 |
Transparency |
61 |
|
|
2.4.01 |
Tariff barriers |
41 |
2.4.08 |
Subsidies |
60 |
|
|
2.3.08 |
Exchange rate stability |
60 |
||||
|
Business Efficiency |
Rank |
Business Efficiency |
Эрэмбэ |
|||
|
3.2.04 |
Remuneration of management |
1 |
3.2.19 |
Finance skills |
63 |
|
|
3.2.01 |
Compensation levels |
4 |
3.3.19 |
Corporate debit |
63 |
|
|
3.2.06 |
Working hours |
20 |
3.1.08 |
Large corporations |
62 |
|
|
3.2.10 |
Employee training |
24 |
3.2.18 |
Skilled labor |
62 |
|
|
3.2.20 |
Attracting and retaining talents |
31 |
3.4.02 |
Changing market conditions |
62 |
|
|
3.2.16 |
Female labor force |
33 |
3.2.24 |
Competent senior managers |
62 |
|
|
3.5.05 |
Need for economic and social reforms |
34 |
3.1.09 |
Small and medium-size enterprises |
62 |
|
|
3.4.03 |
Opportunities and threats |
61 |
||||
|
3.3.14 |
Shareholders’ rights |
61 |
||||
|
3.3.07 |
Regulatory compliance (banking laws) |
61 |
||||
|
Infrastructure |
Rank |
Infrastructure |
Эрэмбэ |
|||
|
4.2.01 |
Investment in Telecommunications |
3 |
4.2.18 |
Cyber security |
63 |
|
|
4.1.21 |
Electricity costs for industrial clients |
6 |
4.2.11 |
Qualified engineers |
63 |
|
|
4.1.07 |
Population – growth |
8 |
4.3.19 |
Medium and high-tech value added |
63 |
|
|
4.2.16 |
High – tech exports (%) |
15 |
4.4.26 |
Pollution problems |
63 |
|
|
4.2.08 |
Broadband subscribers |
26 |
4.5.15 |
University education |
63 |
|
|
4.5.07 |
Secondary school enrollment (%) |
30 |
4.3.22 |
Knowledge transfer |
63 |
|
|
4.2.03 |
Mobile Telephone costs |
32 |
4.2.07 |
Internet users |
62 |
|
|
4.3.11 |
Science degrees |
62 |
||||
|
4.1.04 |
Access to water |
62 |
||||
|
4.1.14 |
Quality of air transportation |
62 |
||||